


Finding pollution’s footprint
Salt Lake City partners to map particles’ sources and movements
EDF and Google Earth Outreach have meticulously measured and mapped air quality in Oakland, Houston and London. And while the air pollution maps allow us to see where pollution is at its worst, they don’t tell us what sources cause these “hotspots.”
A new project with the University of Utah in Salt Lake City will combine similar pollution measurements with meteorological data, to help scientists better track pollution from different sources as it travels and mixes through the Salt Lake City valley.
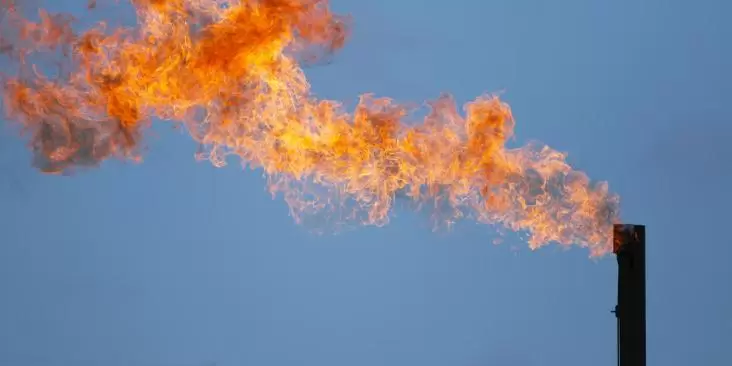
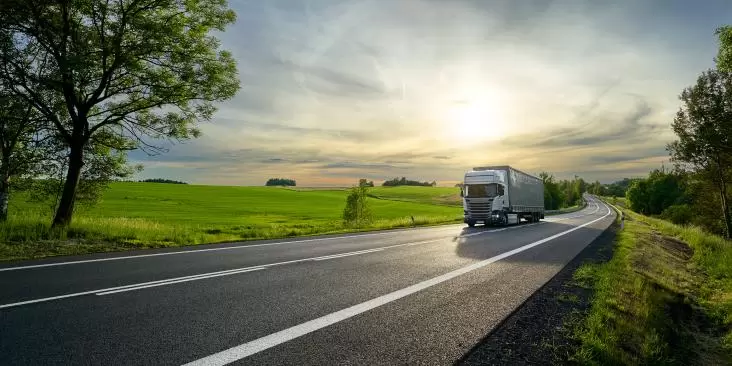
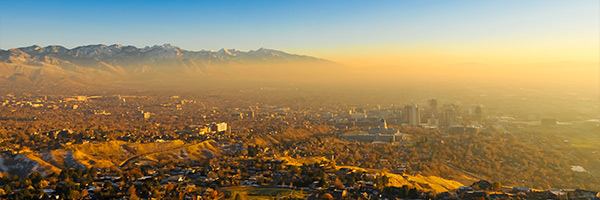
Salt Lake City lies in a valley with the Wasatch Mountains to the east, and the Oquirrh Mountains to the west, which can sometimes limit the ability for “dirty” air to escape. It features a variety of pollution sources, including oil and gas refineries, power plants, agriculture, general industry, and the emissions typical in most cities: on-road cars and trucks, restaurants, and buildings, etc. Additionally, local officials are considering adding an inland port which would likely increase both rail and truck transportation.
Known for its air quality and weather research, the University of Utah has worked with EDF to identify 26 neighborhoods, where two Google Street View cars have been driving since April. The selected zones are a diverse mix of both industrial and residential areas to the north of the city as well as neighborhoods to the south and west. The team has also chosen neighborhoods that are racially and socioeconomically diverse, so we can better understand the pollution burden on different communities. Through the end of 2019, the cars will sample areas as many as 40 times, allowing the team to capture air quality measurements during different times of day, weather conditions and seasons.
Using wind to track pollution’s movements
For this study, EDF and the University of Utah will combine detailed pollution measurements with a computer model of weather that includes hourly wind direction and speed, temperature, and radiation (energy from the sun). Starting at the location where each pollution measurement is taken, we will use this weather data to step backwards in time to generate “footprints” describing the most likely path the air traveled on its way to being measured by the instruments.
The results should help pinpoint sources of elevated pollution. Known as source apportionment, this is a critical next step in air quality research. It could both inform new research projects, and, if replicated, provide communities with actionable data to advocate for cleaner air.

